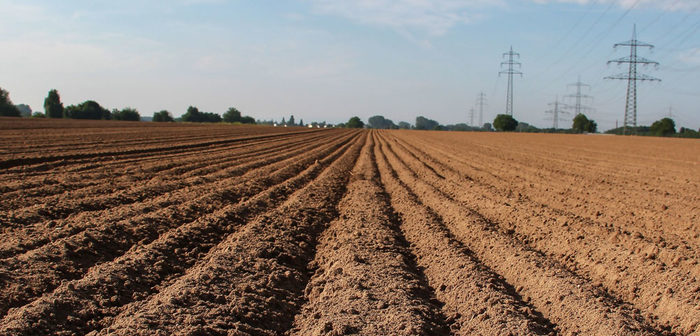
NRM’s annual soil summary is available as an interactive map for the first time this year. Now farmers can drill down into crop type and nutrient summaries for their region and county, so the data they receive is more relevant than ever before.
NRM’s annual soil summary is available as an interactive map for the first time this year. Now farmers can drill down into crop type and nutrient summaries for their region and county, so the data they receive is more relevant than ever before.
The interactive map follows the publication of NRM’s 2020-2021 soil summary with data from thousands of soil samples from farms across the UK collected between June 2020 to May 2021. The interactive map allows farmers and their advisors to select a region and then a county to localise their nutrient summary. Data for phosphorus, potassium and magnesium is split out by arable and grassland and summarised according to the 9th edition of the RB209.
‘For the last 30 years, we have found that two thirds of most soils are deficient in the 3 key nutrients. This year was no different,’ said Alli Grundy, Agronomy manager at NRM. ‘There are some really interesting variations across the UK as well. For example, while arable soils in Cumbria in the North West of England are high in phosphorus but low in potassium, those in Greater London in the south are low in phosphorus and middling in potassium.’
Viewing the consolidated data in this way is more relevant to farms and their conditions than ever before, helping farmers understand the current nutrients status of their soils and benchmark against other farms. Farmers and advisors can then use the data to enhance performance and make insightful decisions about the next year of farming and beyond.
‘A core focus of Cawood is looking for new ways to add value for our customers,’ said Simon Parrington, chief executive officer at Cawood. ‘The interactive soil map, developed by NRM, presents an innovative solution for our customers to easily see how they compare with the rest of the UK and to help them meet their goals. We are really pleased with our digital and data services, which efficiently and effectively help us support a safer, healthier planet.’
Necessary cookies are absolutely essential for the website to function properly. These cookies ensure basic functionalities and security features of the website, anonymously.
| Cookie | Duration | Description |
|---|---|---|
| cookielawinfo-checbox-analytics | 11 months | This cookie is set by GDPR Cookie Consent plugin. The cookie is used to store the user consent for the cookies in the category "Analytics". |
| cookielawinfo-checbox-functional | 11 months | The cookie is set by GDPR cookie consent to record the user consent for the cookies in the category "Functional". |
| cookielawinfo-checbox-others | 11 months | This cookie is set by GDPR Cookie Consent plugin. The cookie is used to store the user consent for the cookies in the category "Other. |
| cookielawinfo-checkbox-necessary | 11 months | This cookie is set by GDPR Cookie Consent plugin. The cookies is used to store the user consent for the cookies in the category "Necessary". |
| cookielawinfo-checkbox-performance | 11 months | This cookie is set by GDPR Cookie Consent plugin. The cookie is used to store the user consent for the cookies in the category "Performance". |
| viewed_cookie_policy | 11 months | The cookie is set by the GDPR Cookie Consent plugin and is used to store whether or not user has consented to the use of cookies. It does not store any personal data. |
Functional cookies help to perform certain functionalities like sharing the content of the website on social media platforms, collect feedbacks, and other third-party features.
Performance cookies are used to understand and analyze the key performance indexes of the website which helps in delivering a better user experience for the visitors.
Analytical cookies are used to understand how visitors interact with the website. These cookies help provide information on metrics the number of visitors, bounce rate, traffic source, etc.
Advertisement cookies are used to provide visitors with relevant ads and marketing campaigns. These cookies track visitors across websites and collect information to provide customized ads.
Other uncategorized cookies are those that are being analyzed and have not been classified into a category as yet.

